The Dashboard elements considered in this example are a number of data visualizations, which represent key performance indicators, such as budget, visits or any other key metrics.
In order to implement the desired setup, we need to take two steps.
First, we need jQuery widgets to render all underlying data and provide an additional level of interaction, such as tooltips, selection and hover effects. Some of the data is also encoded via QR codes, which is suitable for the cases when we need to show either a longer link, or additional information on a given entry, which may not be required immediately.
This task is handled by the ShieldUI web development framework, which offers all of the widgets utilized. From this framework, we utilize its JQuery widgets, such as chart, grid, QR code and rating, which offer excellent client side performance and responsiveness.
Second, we need to ensure that all elements from the dashboard are rendered into separate sections. Additionally, we need to ensure that all such sections are coherently positioned and retain their good appearance on any device. Normally, this is a complicated task. Happily, Bootstrap makes this just a matter of setting a few CSS classes.
The complete sample is available for download here. The finished presentation looks like this:
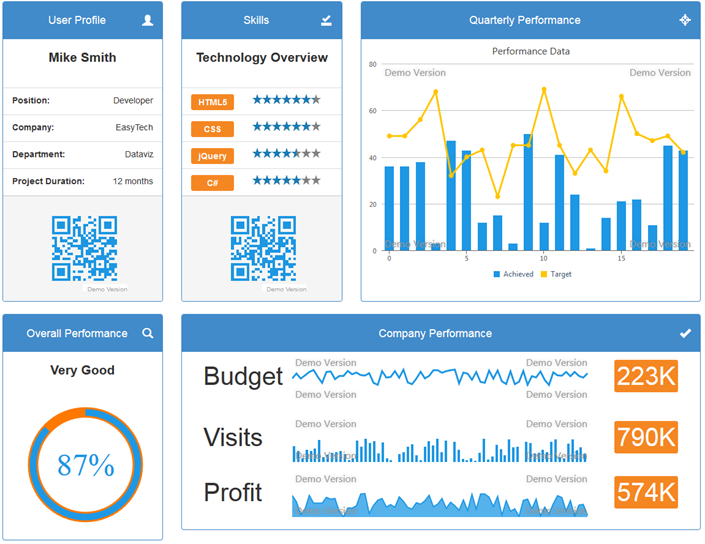
Essentially, the application employs Bootstrap panels to position the jquery Plugins. This takes care of the responsiveness of the application. Then, each widget is initialized via JavaScript, in order to show its data. Feel free to download the sample and review its contents further.