Dec 03, 2014
In this blog I will briefly introduce the
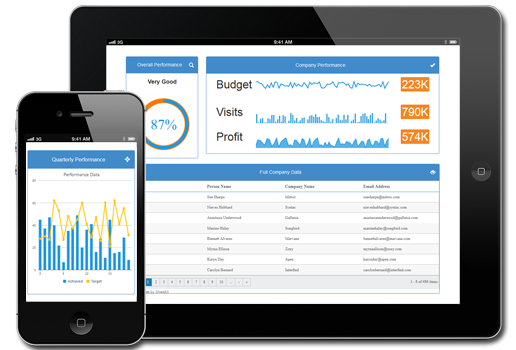
ShieldUI Charting component.
This data visualization tool has a wealth of series types and is easy to integrate into a variety of Bootstrap scenarios, such as
statistics or dashboards implementations.
The aim of every component is to reduce development time and at the same time leave a lot of options for modifications.
Below is a list, which summarizes some of the key features of the
ShieldUI charting component:
-
Over 25 Chart types
-
Wrappers for ASP.NET, ASP.NET MVC and JAVA Wicket
-
Events for improved application responsiveness
-
Tooltips and hover interaction indicators
-
Easy databinding for both the whole chart and inividual series
-
Easy styling options, to allow the control to completely blend into any web development scenario
-
Combinational charts - allow combining any number of different chart series
-
Bootstrap responsive
-
Large array of customization options - alter any element's font, size or color
-
Part of a large suite of over 60 other widget types.
To explore further the charting component or the ShieldUI Suite, its widgets and features, please visit the official site
here
or the demos located
here.