This article contains the latest listing of some of the most widely used JavaScript charting components on the market. Whether you are new to data visualization, or just aiming to stay corrent with the latest on the scene, these libraries are a very good place to start.
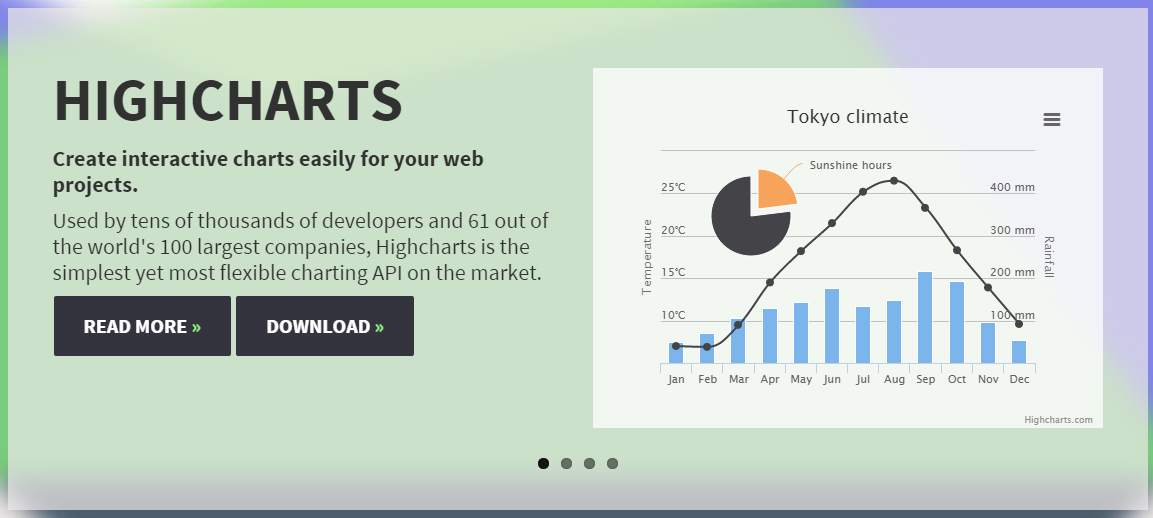
The HighCharts charting tool is probably one of the most famous ones on the market. The company focuses mainly on the development of charting components and has recently offered a map component as well.
The offering is reinforced with a large number of charting types, which are rendered via an SVG in the browser.
To see more information on the components, please follow this link.
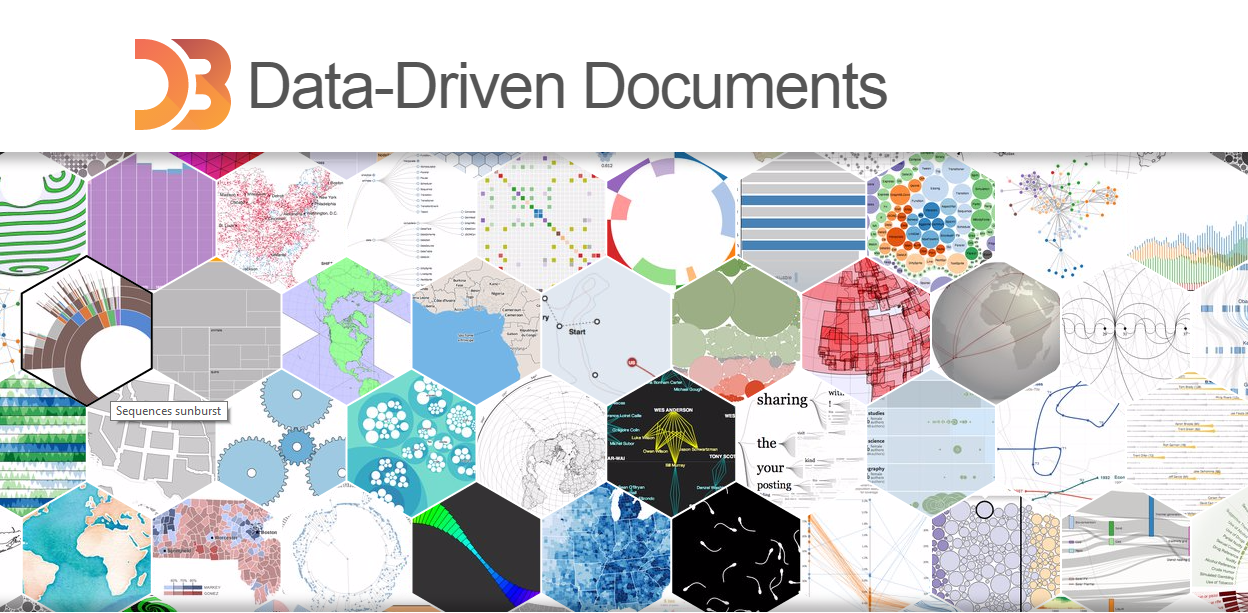
The D3 Solution is a powerful and complex Data Visualization framework, which utilizes HTML, SVG and CSS to render complex charts and graphs.
The Suite also supports dynamic setting of properties, as well as different animations.
To see more information on the components, please go here.
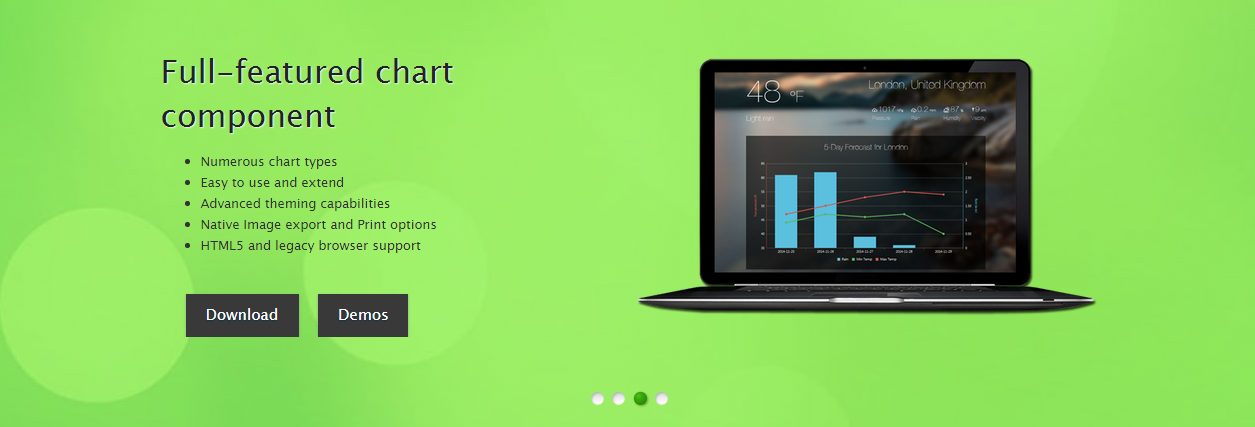
The ShieldUI JavaScript Chart library is a SVG Solution, which has a rich set of fast, animated charts.
The library uses HTML, CSS and JavaScript to enable over 25 charting types.
In addition to the charting solution, the company provides a full set of web components, including grid, input components, barcodes and QR codes, for a total of over 70 widget types.
To see more information on the Suite, please follow this link.
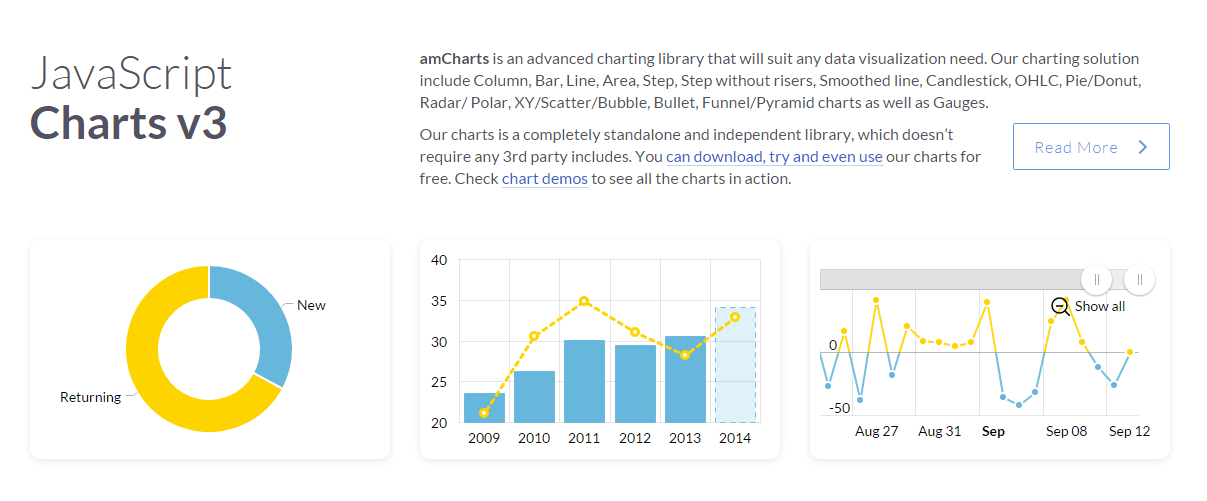
The amChart Charting library is also a rich component set, which exposes Column, Bar, Line, Area, Step, Step without risers, Smoothed line, Candlestick, OHLC, Pie/Donut, Radar/ Polar, XY/Scatter/Bubble, Bullet, Funnel/Pyramid charts as well as Gauges.
The solution also contains a map component, which is useful for data visualization purposes.
To see more information on the charting library, please follow this link.